Introduction#
In broad terms, the goal of mass spectrometry data preprocessing is, starting from raw data measurements, to extract a property associated with the abundance of chemical species in a sample. Usually, this property is compared across multiple samples measured under similar experimental conditions. We refer to such collection of samples as an assay. Data from multiple chemical species are organized into a table or data matrix where each entry in the matrix is associated with a unique (sample, chemical species) pair. We refer to all of the steps involved with creating a data matrix from raw data as MS data preprocessing.
We will use an LC-MS assay to exemplify the typical steps involved during MS data preprocessing This will help us identity some key concepts in MS data preprocessing. The first step in LC-MS data preprocessing is to create EICs from each sample raw data. A peak detection algorithm is then applied to each EIC where each detected peak is, in principle, a single chemical species (this is not strictly true due to potential coellution of multiple ionic species with close m/z values). After chemical species are detected on all samples, they must be grouped according to their chemical identity. Chromatographic peak alignment algorithms are commonly used to this end. Once peaks are aligned, we can build the data matrix using, for example, the peak area as the value for each data matrix entry.
From this example we can extract several insights. First, for each preprocessing step (EIC extraction, peak detection and peak alignment), there is a huge number of algorithms available in the literature. There are also different ways in which the peak area or other properties such as peak width can be computed. It is also important to consider that this analysis was restricted to data preprocessing algorithms for LC-MS, and different strategies may apply for other analytical platforms such as Ambient MS, Direct infusion MS, or Ion Mobility MS. It is clear that a flexible framework for preprocessing mass spectrometry data should be able support all of these multiple analytical platforms, algorithms, and conventions for computing properties from chemical species.
Finally, there are also computational considerations: as the MS instrument resolution and sensitivity increases, datasets become larger in disk size. This results in an increment of the data size of intermediary data. Managing this data in a reliable and efficient manner should be abstracted away from, for example, a developer working on a new peak detection algorithm.
TidyMS was designed from its core with all of these considerations in mind to provide fast, reliable and reproducible tools for MS data preprocessing workflows. we define a workflow as a specification of all the parameters of each preprocessing step that allow to create a data matrix from raw experimental measurements. A workflow has three stages, as described in the following diagram:
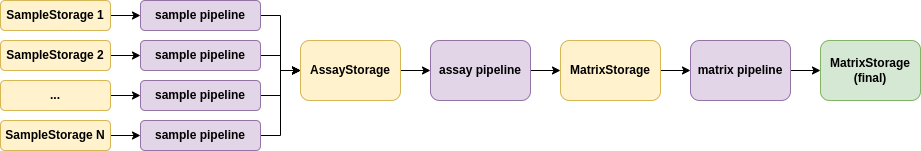
The pipelines that compose a workflow and their associated data storage classes.#
Each stage is associated with a data preprocessing pipeline. On each pipeline, the data is represented as a set of entities (e.g. Sample, ROI, Feature) that define the TidyMS data model. These entities will be discussed in detail in the following sections. Each stage has a storage class that provides an interface to store and retrieve data created in a preprocessing step. Each pipeline (sample, assay or matrix) has a set of allowed operations that can be applied to the data. By defining a set of allowed operations, it is guaranteed that the data will always be in a consistent state. The set of allowed operations that can be applied at each stage of the preprocessing workflow defines the TidyMS data flow. We will focus now on describing the data model and data flow for each stage of the preprocessing workflow.